Next: A model of cancer screening
The impact of delay on cancer survival
By combining the SizeOnly Equation with an exponential growth equation, we can derive an expression for relating the risk of cancer death and time:
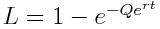
This equation allows us to see directly the rate of the increase in death rate with time, and, as can be seen in the first figure below, over the size ranges where most breast cancers are seen clinically (~10-~150 mm), the slope is remarkably linear, such that  =0.99. This demonstrates why the increase in the risk of cancer death appears to be constant over time.
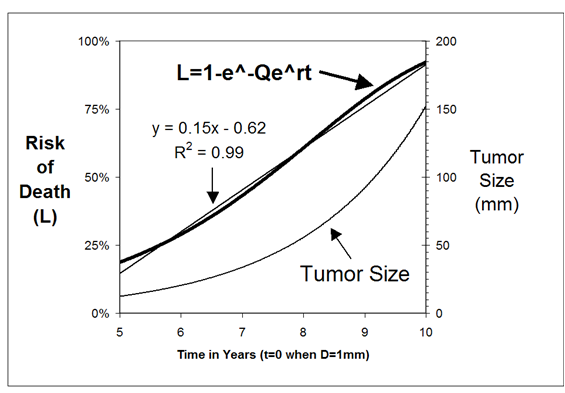
The change in cancer lethality over time can be displayed visually by graphing the relationship between the breast carcinoma death rate and the  of tumor diameter, since the of tumor diameter increase by 1 every time a tumor doubles in diameter. Indeed, as can be seen in the second figure above, data from 500,000+ female breast carcinoma patients in the SEER dataset reveals a remarkably linear relationship between the 15-year Kaplan-Meier breast carcinoma death rate and the of tumor diameter (=0.97). The fact that the slope of this line is 0.163 means that each time these tumors double in diameter the risk of death increases by ~16%.
A numbers of studies have measured the breast carcinoma diameter doubling time, yielding values between 8 and 26 months, with a value of 13 months being derived from data on the cancers seen at this institution. It follows from these growth estimates, together with the finding that the line capturing the relationship between the breast carcinoma death rate and the of tumor diameter has a slope of 0.163, that the risk of death should be expected to increase at the constant rate of approximately 0.5% to 2% per month, with ~1.25% per month being the value when using the 13 month doubling time estimate (0.163/13=0.00125).
The mean period of time from the initial consultation until the time to treatment among the women over age 65 in the US SEER dataset is 102 days (3.4 months). It follows that this amount of time should be expected to result in ~4.25% increase in the breast cancer death rate (3.4 * 1.25%). Since there are more than 212,000 cases of breast carcinoma diagnosed in the United States each year, this translates into as many as 9,000 deaths. In short, every year, approximately 9,000 were curable on the day their cancers became detected, but became incurable by the time the medical system finally treated them. Sincer there are approximately 40,000 breast carcinoma deaths each year, this means that approximately 1 in 4 deaths could have been prevented by more prompt treatment.
Finally, an examination of the distributions of various periods of time that occur until cancer treatment has occurred reveals that most of the lethality that accumulates over time occurs in a small number of women who experience very long periods of delay, while the majority of women experience relatively brief periods of delay, with little lethal consequence. For example, while 90% of the women with the shortest periods from the time of the mammogram until the time of diagnosis in the British Columbia population studied by Olivotto et al [Cancer 94(8), 2002] had a mean period of time of 1.96 months and thus an increased risk of death ascribable of delay of 2.45%, the 10% of the women with the longest periods of delay had a mean period of time of 11 months and thus almost a 6-fold greater increased risk of death of 13.7%.